Dashboard Maintenance
The system administrator is responsible for updating the data used to calculate points on the dashboard charts. Let's look at the Engineering Efficiency dashboard as an example.
Each dashboard consists of charts. The Engineering Efficiency dashboard contains the ECR Cycle Time and Standard vs. Fast Track charts.
Accessing specific data metrics
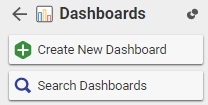
- From the Navigation pane, click Administration Dashboards. The following menu appears:
-
Click Search Dashboard.
- Select the Engineering Efficiency dashboard, and open it for editing. Notice that there are two charts associated with this dashboard.
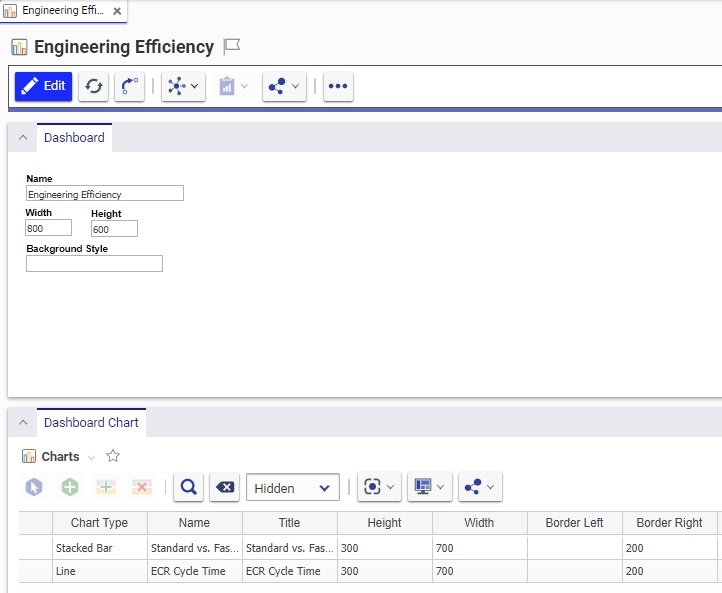
- Right click on the Standard vs. Fast Track chart in the table, and select View Charts from the popup menu. The Chart form should display.
Each chart contains the meta data about the chart itself, such as the axes set up, labels, legend, borders, etc., as well as the chart series, or the metrics that are used to plot the data.
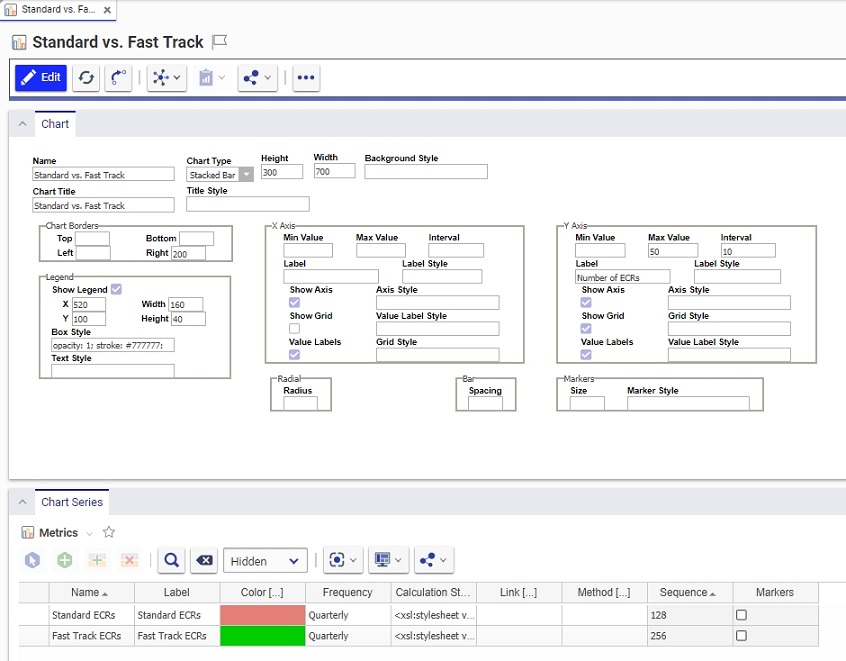
- Select the Fast Track ECRs chart series in the table, right click, and select View Metrics from the popup menu. You will see the metrics form. This is the form that you will be updating.
- Take a careful look at this form. Notice that the current quarter is the only one that has the Calculate box checked. This is because the values are calculated quarterly, i.e. how many fast track ECRs were created this quarter? Once the quarter is over, the final value is kept, and does not have to be recalculated again. Also, checking the Calculate box will refresh the data based on the Query each time a user views the dashboard.
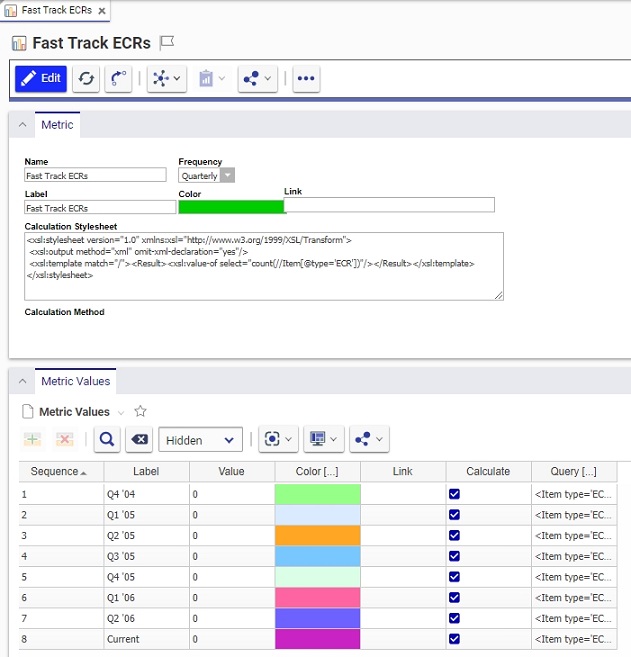
So, at the end of each quarter, the system administrator has to update any metrics which are date driven. In this example, the query is updated to calculate for the next quarter, and keep the current quarter's value unchanged. Here is how to do this.
To update the metrics to calculate for the next quarter:
-
Choose the Current metric value, and select Copy from the right-click popup menu.
-
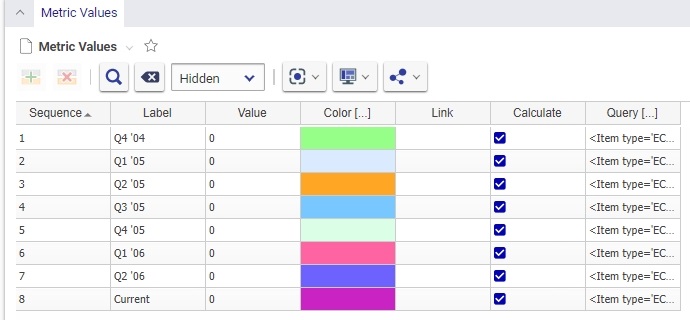
Create a new line, and Paste. Your metric now looks like this:
-
Go back to the line labeled Current. Change the label to the quarter that it refers to, in our case - Q5 '05.
-
Uncheck the Calculated box. The final value that was calculated for that quarter will be retained in the Value column.
-
Edit the newly created line.
-
Change the Sequence number of the new entry to 9 (or the next increment).
-
Change the Label of the new entry to te next quarter, in this case Q2 '05.
-
Select a new color.
-
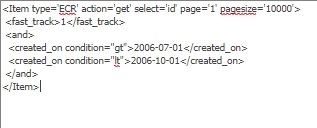
Click on the Query item to bring up the text editor dialog. Notice that the query basically has two dates in it. IT will collect all fast track ECRs in the system that have a creation date greater than a particular date and less then another date. It is these t wo dates that we will change to reflect the new quarter. In our case, or Q2 '05, the first date will be 04/01/2005. The second date will be 07/01/2005. So, the query looks like this"
- Save everything, and repeat this process for all other chart metrics.